3 Item and Test Development
Chapter 3 of the 2014–2015 Technical Manual—Integrated Model (Dynamic Learning Maps Consortium, 2016a) describes item and test development procedures. This chapter provides an overview of updates to item and test development for the 2020–2021 academic year. The first portion of the chapter provides an overview of 2020–2021 item writers’ characteristics, followed by the 2020–2021 external review of items, testlets, and texts based on criteria for content, bias, and accessibility. The next portion of the chapter describes changes to the pool of operational and field test testlets available for administration during 2020–2021.
For a complete description of item and test development for DLM assessments, including information on the use of evidence-centered design and Universal Design for Learning in the creation of concept maps used to guide test development, see the 2014–2015 Technical Manual—Integrated Model (Dynamic Learning Maps Consortium, 2016a).
3.1 Items and Testlets
This section describes information pertaining to item writing and item writer demographics for the 2020–2021 year. For a complete summary of item and testlet development procedures that were developed and implemented in 2014–2015 and continue to be used in 2020–2021, see Chapter 3 of the 2014–2015 Technical Manual—Integrated Model (Dynamic Learning Maps Consortium, 2016a).
3.1.1 Item Writing
Item development for 2020–2021 was reduced in scope to support an initiative to review and refresh resources that guide the development of items and testlets.
3.1.1.1 Item Writers
Item writers were selected from the ATLAS Recruitment Platform based on predetermined qualifications such as special education teaching experience and previous DLM item writing experience. The ATLAS Recruitment Platform is a profile-based recruitment tool hosted in MemberClicks, a membership management software. Individuals create their participant profile, which can be accessed and updated at any time. We encourage individuals to update their profile information annually or at the time of event recruitment for reporting accuracy. Participant profiles include attribute fields to capture demographic, education, and work experience data. Item writers were assigned to a subject area based on their qualifications and previous DLM item writing experience. In total, 11 item writers contributed to writing testlets during the 2020–2021 year, including five for ELA and six for mathematics
The median and range of years of item writers’ teaching experience is shown in Table 3.1. Of the item writers who responded to the item, the median years of experience was at least seven years for item writers of both ELA and mathematics testlets in pre-K–12 and at least 2 years of special education experience.
|
English language arts
|
Mathematics
|
|||||
|---|---|---|---|---|---|---|
| Area | n | Median | Range | n | Median | Range |
| English language arts | 2 | 9.5 | 9–10 | 4 | 22.5 | 8–25 |
| Pre-K–12 | 3 | 9.0 | 7–10 | 6 | 22.5 | 10–37 |
| Mathematics | 2 | 9.5 | 9–10 | 6 | 18.0 | 5–25 |
| Special education | 3 | 8.0 | 7–9 | 5 | 10.0 | 2–16 |
| * The n columns indicate the number of nonmissing responses to the survey question. | ||||||
The level and types of degrees held by item writers are shown in Table 3.2 and Table 3.3, respectively. All item writers held at least a bachelor’s degree. A majority (n = 9; 82%) also held a master’s degree, for which the most common field of study was education (n = 6; 67%).
|
English language arts
|
Mathematics
|
|||
|---|---|---|---|---|
| Degree | n | % | n | % |
| Bachelor’s degree | 5 | 100.0 | 6 | 100.0 |
| Master’s degree | 3 | 60.0 | 6 | 100.0 |
|
English language arts
|
Mathematics
|
|
|---|---|---|
| Degree | n | n |
| Bachelor’s degree | ||
| Education | 0 | 2 |
| Content specific | 0 | 1 |
| Special education | 0 | 0 |
| Other | 3 | 3 |
| Missing | 2 | 0 |
| Master’s degree | ||
| Education | 0 | 6 |
| Content specific | 1 | 0 |
| Special education | 2 | 0 |
| Other | 0 | 0 |
| Missing | 0 | 0 |
Item writers reported a range of experience working with students with different disabilities, as summarized in Table 3.4. Item writers collectively had the most experience working with students with a mild cognitive disability, a significant cognitive disability, or multiple cognitive disabilities.
|
English language arts
|
Mathematics
|
|||
|---|---|---|---|---|
| Disability category | n | % | n | % |
| Blind/Low vision | 1 | 20.0 | 4 | 66.7 |
| Deaf/Hard of hearing | 1 | 20.0 | 4 | 66.7 |
| Emotional disability | 3 | 60.0 | 4 | 66.7 |
| Mild cognitive disability | 3 | 60.0 | 5 | 83.3 |
| Multiple disabilities | 3 | 60.0 | 5 | 83.3 |
| Orthopedic impairment | 0 | 0.0 | 3 | 50.0 |
| Other health impairment | 3 | 60.0 | 4 | 66.7 |
| Significant cognitive disability | 3 | 60.0 | 5 | 83.3 |
| Specific learning disability | 3 | 60.0 | 4 | 66.7 |
| Speech impairment | 2 | 40.0 | 4 | 66.7 |
| Traumatic brain injury | 0 | 0.0 | 3 | 50.0 |
| Not reported | 2 | 40.0 | 1 | 16.7 |
3.1.1.2 Item Writing Process
The selected item writers participated in a 1-day refresher virtual meeting that was held on February 10, 2021. Item writer refresher training included a review of the item writing process and procedures for reviewing peers’ items. Following the training, item writing pairs collaborated and began the development of testlets. Following the refresher meeting, item writers continued producing and peer reviewing testlets virtually via a secure online platform through April 2021. A total of 48 testlets were produced: 24 English language arts testlets and 24 mathematics testlets.
3.2 External Reviews
The purpose of panelists externally reviewing items and testlets developed for the DLM Alternate Assessment System is to evaluate whether the items and testlets measure the intended content, are accessible, and are free of biased or sensitive content. Panelists use external review criteria established for DLM alternate assessments to recommend items be accepted, revised, or rejected. Panelists also provide recommendations for revisions or an explanation for a reject rating. The test development team uses the collective feedback from the panelists to inform decisions about items and testlets before they are field-tested.
External review for 2020–2021 changed from a 2-day onsite event to 49 virtual 4-hour panel meetings that spanned over 3 weeks due to travel restrictions caused by the COVID-19 pandemic. Materials were updated to meet the needs of virtual panel meetings, including the advance training and facilitator and co-facilitator training. When held in person, one facilitator led the feedback discussion for each panel. This year, a facilitator and co-facilitator led the feedback discussions and recorded decisions for each panel meeting.
3.2.1 Review Recruitment, Assignments, and Training
Panelists were selected from the ATLAS Recruitment Platform based on predetermined qualifications for each panel type. The ATLAS Recruitment Platform is populated using a profile creation survey that captures demographic, education, and work experience of candidates from DLM partner states. Panelists were assigned to content, accessibility, or bias and sensitivity panels based on their qualifications.
In fall 2020, there were 55 panelists selected, including 26 ELA panelists (5 accessibility panelists, 11 content panelists, and 10 bias and sensitivity panelists) and 29 mathematics panelists (9 accessibility panelists, 13 content panelists, and seven bias and sensitivity panelists).
Prior to participating in the virtual panel meetings, panelists completed an advance training course that included an External Review Procedures module and a module for their assigned panel type. The content modules were subject specific, while the accessibility and bias and sensitivity modules were universal for all subjects. After each module, panelists completed a quiz and were required to score 80% or higher to pass advance training.
After completing the modules and corresponding quizzes, panelists completed a practice activity that simulated the external review process for each panel type. Panelists used the criteria for their assigned panel type to complete this external review.
Following the completion of advance training, panelists completed asynchronous reviews on two or three collections of testlets dependent upon panel type. Collections had between 34 and 54 testlets, dependent on the panel type. Content panels had fewer testlets per collection, and bias and sensitivity and accessibility panels had more testlets per collection. Ratings from the asynchronous reviews were sorted and new collections were created containing items and testlets with discrepant ratings by a panel. Dependent on the subject, there were two to four virtual panel meetings led by facilitators and co-facilitators to obtain collective feedback about the items and testlets.
The professional roles reported by the 2020–2021 panelists are shown in Table 3.5. Roles include classroom teacher, district staff, instructional coach, and other. Examples of “other” roles included administrators, program coordinators, process coordinators, supervisors of instruction, assessment coordinators, content leads, instruction supervisors, and individuals identifying with multiple categories.
|
English language arts
|
Mathematics
|
|||
|---|---|---|---|---|
| Role | n | % | n | % |
| Classroom teacher | 22 | 84.6 | 26 | 89.7 |
| District staff | 1 | 3.8 | 2 | 6.9 |
| Instructional coach | 0 | 0.0 | 1 | 3.4 |
| Other | 3 | 11.5 | 0 | 0.0 |
Panelists had varying experience teaching students with the most significant cognitive disabilities. ELA panelists had a median of 6.5 years of experience, with a minimum of 0 and a maximum of 27 years of experience. Mathematics panelists had a median of 7 years of experience teaching students with the most significant cognitive disabilities, with a minimum of 0 and a maximum of 20 years of experience.
ELA panelists were from eight different states, and mathematics panelists were from nine different states. Population density of schools in which panelists taught or held a position is reported in Table 3.6. Within the profile creation survey, rural was defined as a population living outside settlements of 1,000 or fewer inhabitants, suburban was defined as an outlying residential area of a city of 2,000–-49,999 inhabitants, and urban was defined as a city of 50,000 inhabitants or more.
|
English language arts
|
Mathematics
|
|||
|---|---|---|---|---|
| Population density | n | % | n | % |
| Rural | 15 | 57.7 | 13 | 44.8 |
| Suburban | 6 | 23.1 | 6 | 20.7 |
| Urban | 5 | 19.2 | 10 | 34.5 |
Panelists recommended most content be accepted. For ELA, 162 testlets containing 810 items were reviewed. The percentage of items rated as accept across grades, panels, and rounds of review ranged from 79% to 99%. The percentage of testlets rated as accept across grades, panels, and rounds of review ranged from 97% to 100%. The percentage of items and testlets rated as revise across grades, panels, and rounds of review ranged from 1% to 17% and 0% to 1%, respectively. The rate at which items and testlets were recommended for rejection ranged from 1% to 3% and 0% to 2%, respectively, across grades and grade bands, panels, and rounds of review.
For mathematics, 232 testlets containing 1,160 items were reviewed. The percentage of items and testlets rated as accept ranged from 67% to 96% and 94% to 99%, respectively, across grades, panels, and rounds of review. The percentage of items and testlets rated as revise across grades, panels, and rounds of review ranged from 4% to 33% and 0.4% to 6% respectively. The rate at which both items and testlets were recommended for rejection ranged from 0% to 1% across grades and grade bands, panels, and rounds of review.
3.2.2 Test Development Decisions
Because each item and testlet is examined by three distinct panels, ratings were compiled across panel types, following the process established in 2017–2018. The test development team reviewed the collective feedback provided by the panelists for each item and testlet. There are five decision options for the test development team to apply to each item and testlet: (a) accept as is, no pattern of similar concerns (b) minor revision, pattern of minor concerns, will be addressed; (c) major revision needed; (d) reject; and (e) more information needed. Once the test development team views each item and testlet and considers the feedback provided by the panelists, it assigns a decision to each one.
The ELA test development team accepted as is 98% of testlets and 91% of items. Of the items and testlets that were revised, most required only minor changes (e.g., minor rewording but concept remained unchanged), as opposed to major changes (e.g., stem or response option replaced). The ELA test development team made 72 minor revisions, and one major revision to items. The team rejected zero testlets.
The mathematics test development team accepted as is 94% of testlets and 99% of items. Of the items and testlets that were revised, most required major changes (e.g., stem or response option replaced) as opposed to minor changes (e.g., minor rewording but concept remained unchanged). The mathematics test development team made 130 minor revisions and 272 major revisions to items. The team rejected 13 testlets.
3.3 English Language Arts Texts
This section describes the development and external review of ELA texts, which are then incorporated into testlets that are externally reviewed through the standard testlet review process.
3.3.1 Development of Texts
Throughout 2019–2020, the ELA test development team created new reading literature and reading informational texts. To determine the number and types of new texts needed, Essential Elements (EEs) and linkage levels were identified where two or fewer texts were available, and/or available texts could not support five items per testlet.
Based on these criteria, it was determined that 32 new texts would provide the needed coverage. During the internal text development process, two of the draft reading literature texts were cut, resulting in a total of 30 new texts written. The number and types of texts created for each grade or grade band are summarized in Table 3.7. Just over half of the new ELA texts (n = 16; 53%) were reading informational texts. There were 14 (47%) new reading literature texts written.
| Grade/Grade band | Reading literature | Reading informational | Total |
|---|---|---|---|
| 3 | 2 | 2 | 4 |
| 4 | 2 | 2 | 4 |
| 5 | 2 | 2 | 4 |
| 6 | 2 | 2 | 4 |
| 7 | 2 | 2 | 4 |
| 8 | 2 | 2 | 4 |
| 9–10 | 0 | 2 | 2 |
| 11–12 | 2 | 2 | 4 |
| Total | 14 | 16 | 30 |
Following the identification of needed ELA texts, the specifications for each new text to be developed-—including nodes, text type (reading literature or reading informational text), and the exemplar source book-—were identified. ELA test development staff wrote, selected images for, and reviewed each text. Following review, the texts and images were reviewed by Special Education experts and senior DLM staff to evaluate whether each ELA text met DLM guidelines and supported the assigned Essential Elements, linkage levels, and nodes. The ELA texts received an editorial review before being finalized for external review.
3.3.2 External Review of Texts
The purpose of the external review of texts developed for the DLM Alternate Assessment System is to evaluate whether they are measuring the intended content, are accessible, are free of biased or sensitive content, and include appropriate imagery. Panelists also provide recommendations for revisions or an explanation for a reject rating. The ELA test development team uses the collective feedback from the panelists to inform decisions about texts and images before they are used in item and testlet development.
External review of texts for 2020–2021 changed from an asynchronous virtual review to a 2-day virtual event with panel meetings. The facilitator and co-facilitator training were updated to meet the needs of virtual panel meetings, and the panelist advance training was revamped to be more comprehensive. Instead of two advance training modules, panelists completed one advance training module designed to provide background information on the DLM alternate assessment and DLM ELA testlets and texts and received more rigorous training from DLM staff at the beginning of the event. Previously, panelists reviewed texts independently and provided feedback via an online survey tool. This year, a facilitator and co-facilitator led the feedback discussions and recorded decisions for each panel meeting. Senior members of the DLM leadership team used their industry experience to help the ELA team revise established text criteria to better reflect current assessment knowledge and practice.
3.3.3 Recruitment, Training, Panel Meetings, and Results
Panelists were selected from the ATLAS Recruitment Platform based on predetermined qualifications for each panel type. The ATLAS Recruitment Platform is populated using a profile creation survey that captures demographics, education, and work experience of candidates from DLM partner states. Panelists were assigned to content, accessibility, bias and sensitivity, or text image panels based on their qualifications.
In fall 2021, 57 panelists who had experience with ELA content and/or experience with students with significant cognitive disabilities were recruited to participate. Of the 57 panelists, 39 (68%) panelists were primarily classroom teachers, 1 (2%) panelist was a district staff member, 5 (9%) panelists were state education agency staff, and 12 (21%) panelists had other roles (i.e., instructional coach, item developer, university faculty). Panelists had varying experience teaching special education, with a median of 10 years of experience, a minimum of 4 years of experience, and a maximum of 30 years of experience. Of panelists who disclosed their ethnicity, 55 (96%) panelists were non-Hispanic/Latino and 1 (2%) panelist was Hispanic/Latino. Among the panelists, 52 (91%) were female and 4 (7%) were male; 1 (2%) panelist chose not to disclose their gender. Panelists taught or worked in a mix of rural (n = 28, 49%), suburban (n = 14, 25%), and urban (n = 15, 26%) locations. Panelists represented 17 partner states, including 5 Instructionally Embedded model states and 12 Year-End model states; 3 panelists did not indicate their state.
Following the completion of the advance training module, the texts were provided to the panelists via a secure file-sharing platform. Panelists used the criteria for their assigned panel type to complete asynchronous reviews. Following asynchronous review, facilitators hosted panel meetings. Additional training on the structure and process of consensus discussions, panel-specific criteria, and resources were provided during the first panel meeting. During the panel meetings, panelists engaged in criteria-based discussion of each text to provide a consensus rating of the text. Panelists also made comments and suggested revisions to words and images. The co-facilitator recorded consensus ratings and recommendations for revision on text rating sheets. In cases in which panelists recommended revisions, texts were revised to enhance language clarity, cohere with images, or better align with the text criteria. As shown in Table 3.8, all texts were either accepted based on reviews or accepted after making revisions. In some cases, revisions were made to texts that were rated as “Accept as is” by the panelists. This is because certain aspects are meant to be consistent across all texts (e.g., an edit to a character image that appears in multiple texts). Thus, if a revision is recommended for one text, a parallel edit may be made for other texts, even if the other text was rated as “Accept.”
| Panel ratings | Texts accepted as is | Texts revised per panel suggestion | Texts revised per DLM staff suggestion | Texts rejected per panel suggestion | Texts rejected per staff suggestion |
|---|---|---|---|---|---|
| Accept as is | 4 | 0 | 13 | 0 | 0 |
| Revise | 0 | 26 | 0 | 0 | 0 |
| Reject | 0 | 0 | 0 | 0 | 0 |
| Note. Texts can be revised per panel suggestion and per staff suggestion. |
3.4 Operational Assessment Items for 2020–2021
There were several updates to the pool of operational items for 2020–2021: 55 testlets were promoted to the operational pool from field testing in fall 2019, including 34 ELA testlets and 21 mathematics testlets. Additionally, 306 testlets (9% of all testlets) were retired due to model fit. For a discussion of the model-based retirement process, see Chapter 5 of this manual.
Testlets were made available for operational testing in 2020–2021 based on the 2019–2020 operational pool and the promotion of testlets field-tested during 2019–2020 to the operational pool following their review. Because assessments were cancelled in spring 2020, this only included items that were field tested in fall 2019, prior to the spring cancellation. Table 3.9 summarizes the total number of operational testlets for 2020–2021. In total, there were 3,149 operational testlets available. This total included 576 EE/linkage level combinations (349 ELA, 227 mathematics) for which both a general version and a version for students who are blind or visually impaired or read braille were available.
Operational assessments were administered during the two instructionally embedded windows. A total of 287,704 test sessions were administered during both assessment windows. One test session is one testlet taken by one student. Only test sessions that were complete at the close of each testing window counted toward the total sessions.
|
Fall operational
|
Spring operational
|
|||
|---|---|---|---|---|
| Grade | English language arts (n) | Mathematics (n) | English language arts (n) | Mathematics (n) |
| 3 | 125 | 66 | 125 | 58 |
| 4 | 126 | 94 | 118 | 91 |
| 5 | 152 | 90 | 134 | 86 |
| 6 | 138 | 65 | 120 | 67 |
| 7 | 113 | 83 | 98 | 78 |
| 8 | 134 | 80 | 94 | 76 |
| 9–10 | 113 | 172 | 92 | 152 |
| 11–12 | 114 | * | 95 | * |
| * In mathematics, high school is banded in grades 9–11. | ||||
Similar to previous years, the proportion correct (p-value) was calculated for all operational items to summarize information about item difficulty.
Figure 3.1 and Figure 3.2 include the p-values for each operational item for ELA and mathematics, respectively. To prevent items with small sample sizes from potentially skewing the results, the sample size cutoff for inclusion in the p-value plots was 20. In general, ELA items were easier than mathematics items, as evidenced by the presence of more items in the higher bin (p-value) ranges.
Figure 3.1: Probabilities for ELA 2020–2021 Operational Items
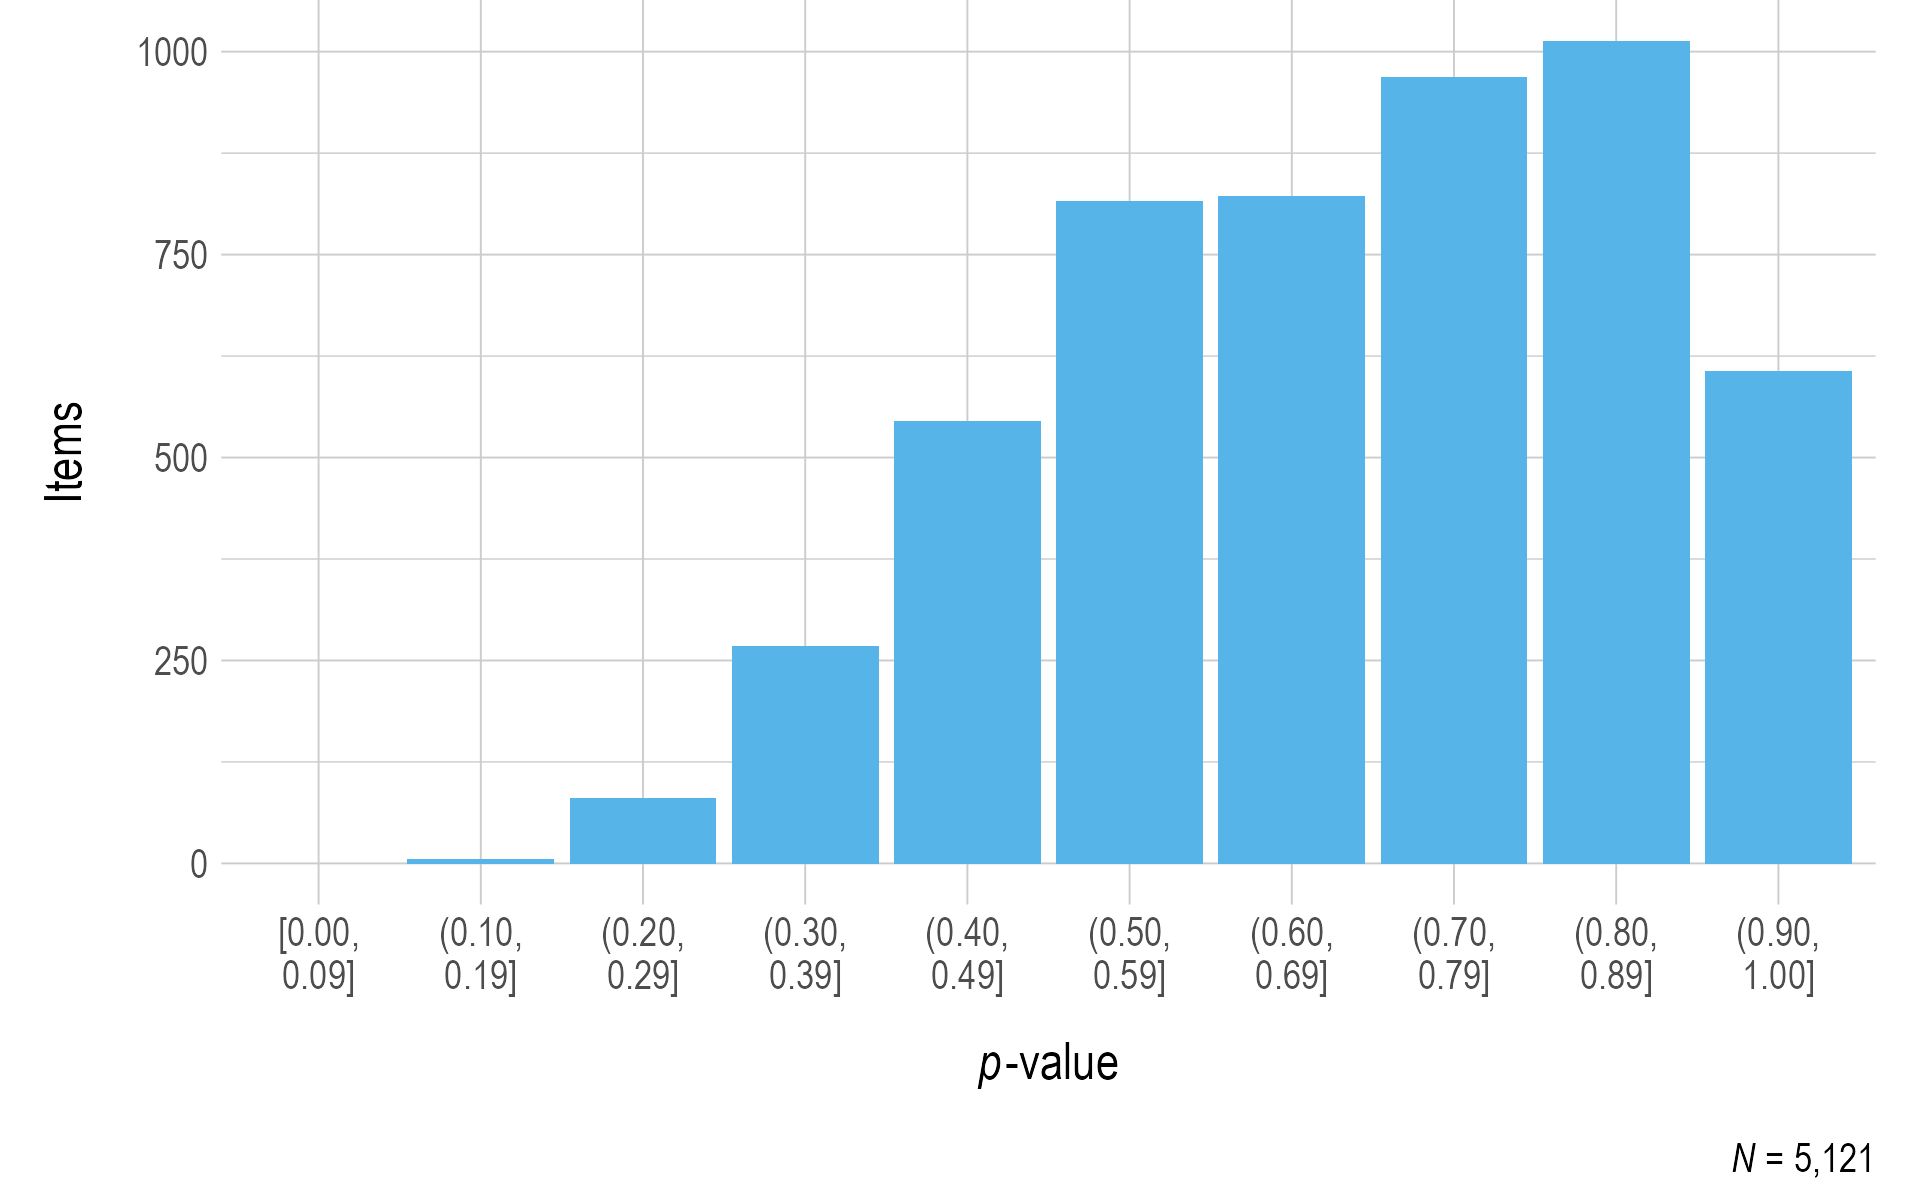
Note. Items with a sample size of less than 20 were omitted.
Figure 3.2: Probabilities for Mathematics 2020–2021 Operational Items
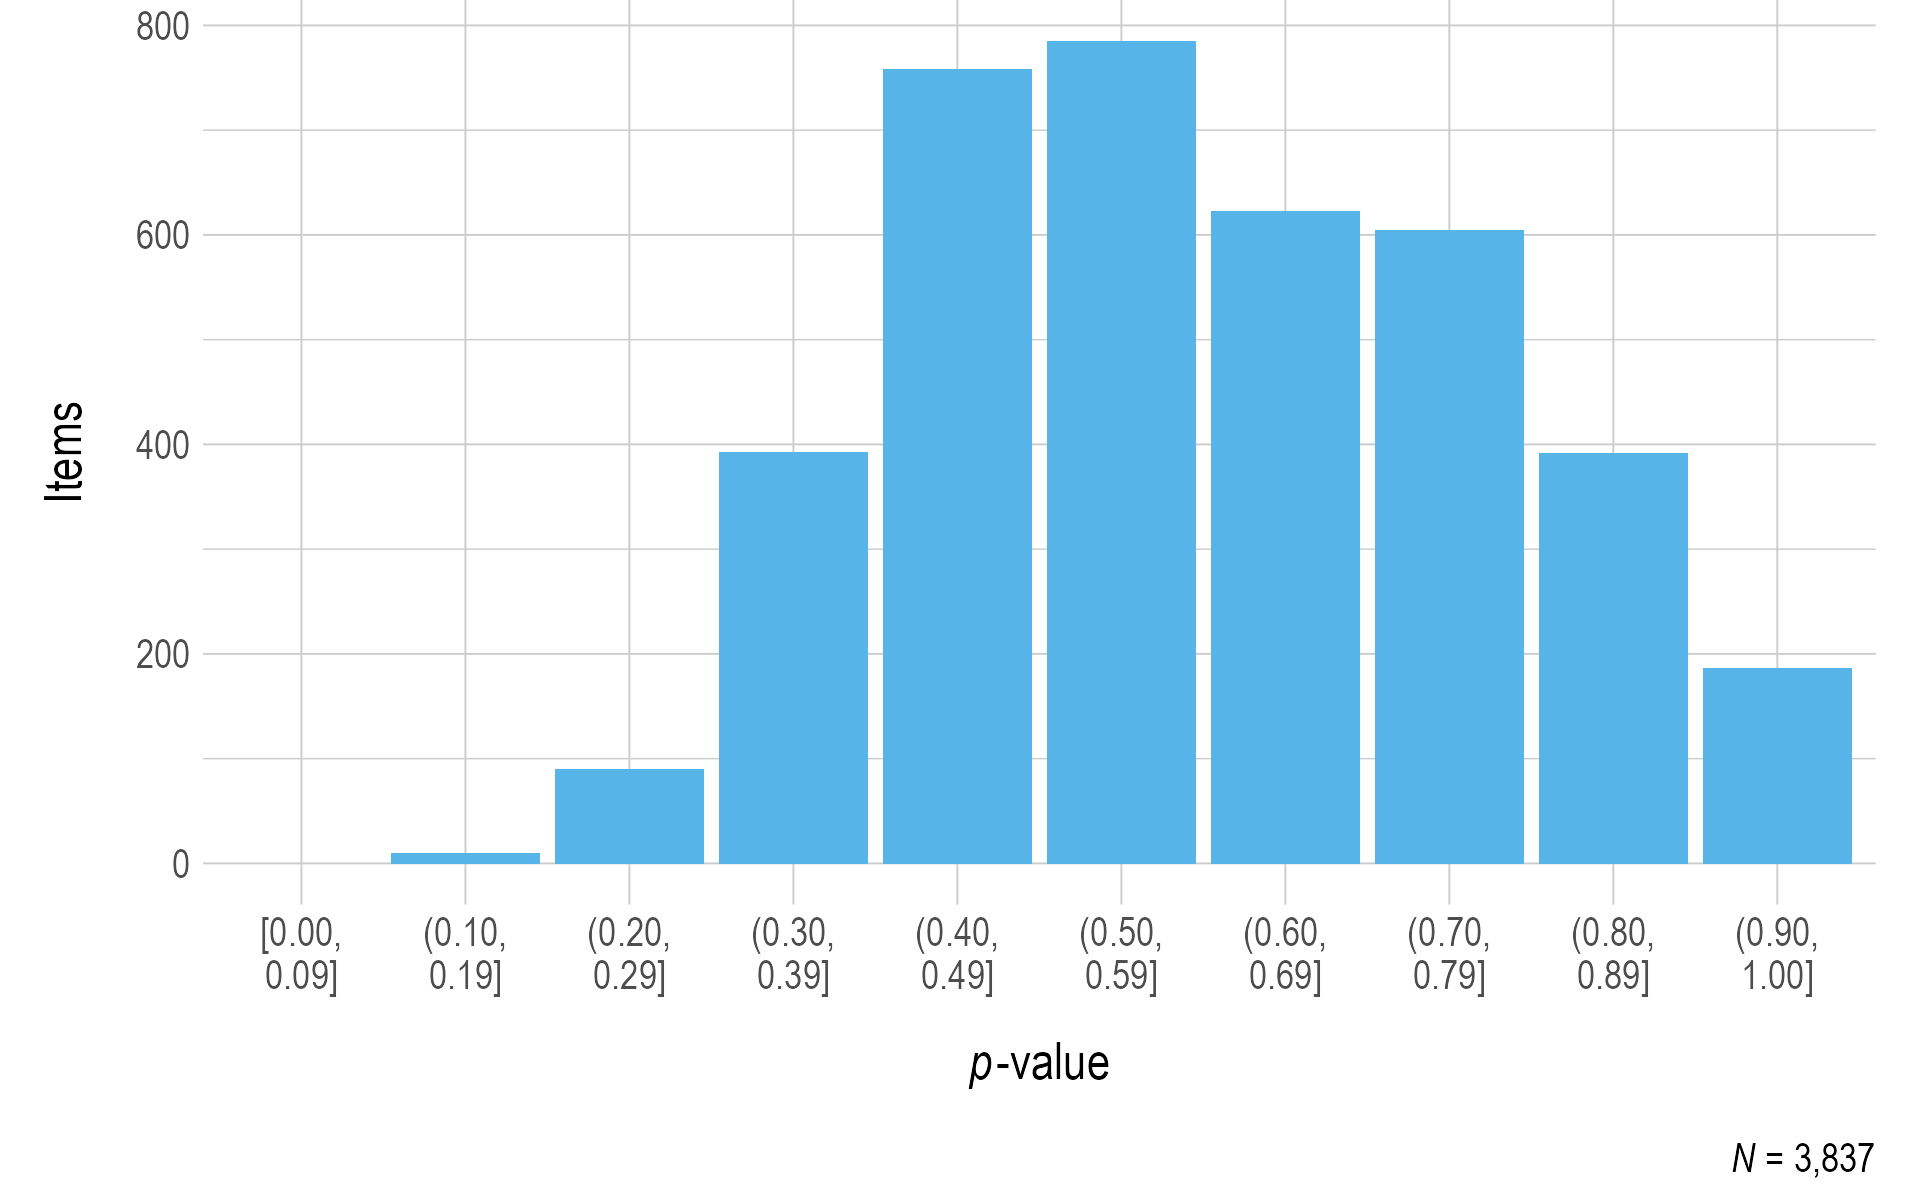
Note. Items with a sample size of less than 20 were omitted.
Standardized difference values were also calculated for all operational items, with a student sample size of at least 20 required to compare the p-value for the item to all other items measuring the same EE and linkage level. The standardized difference values provide one source of evidence of internal consistency.
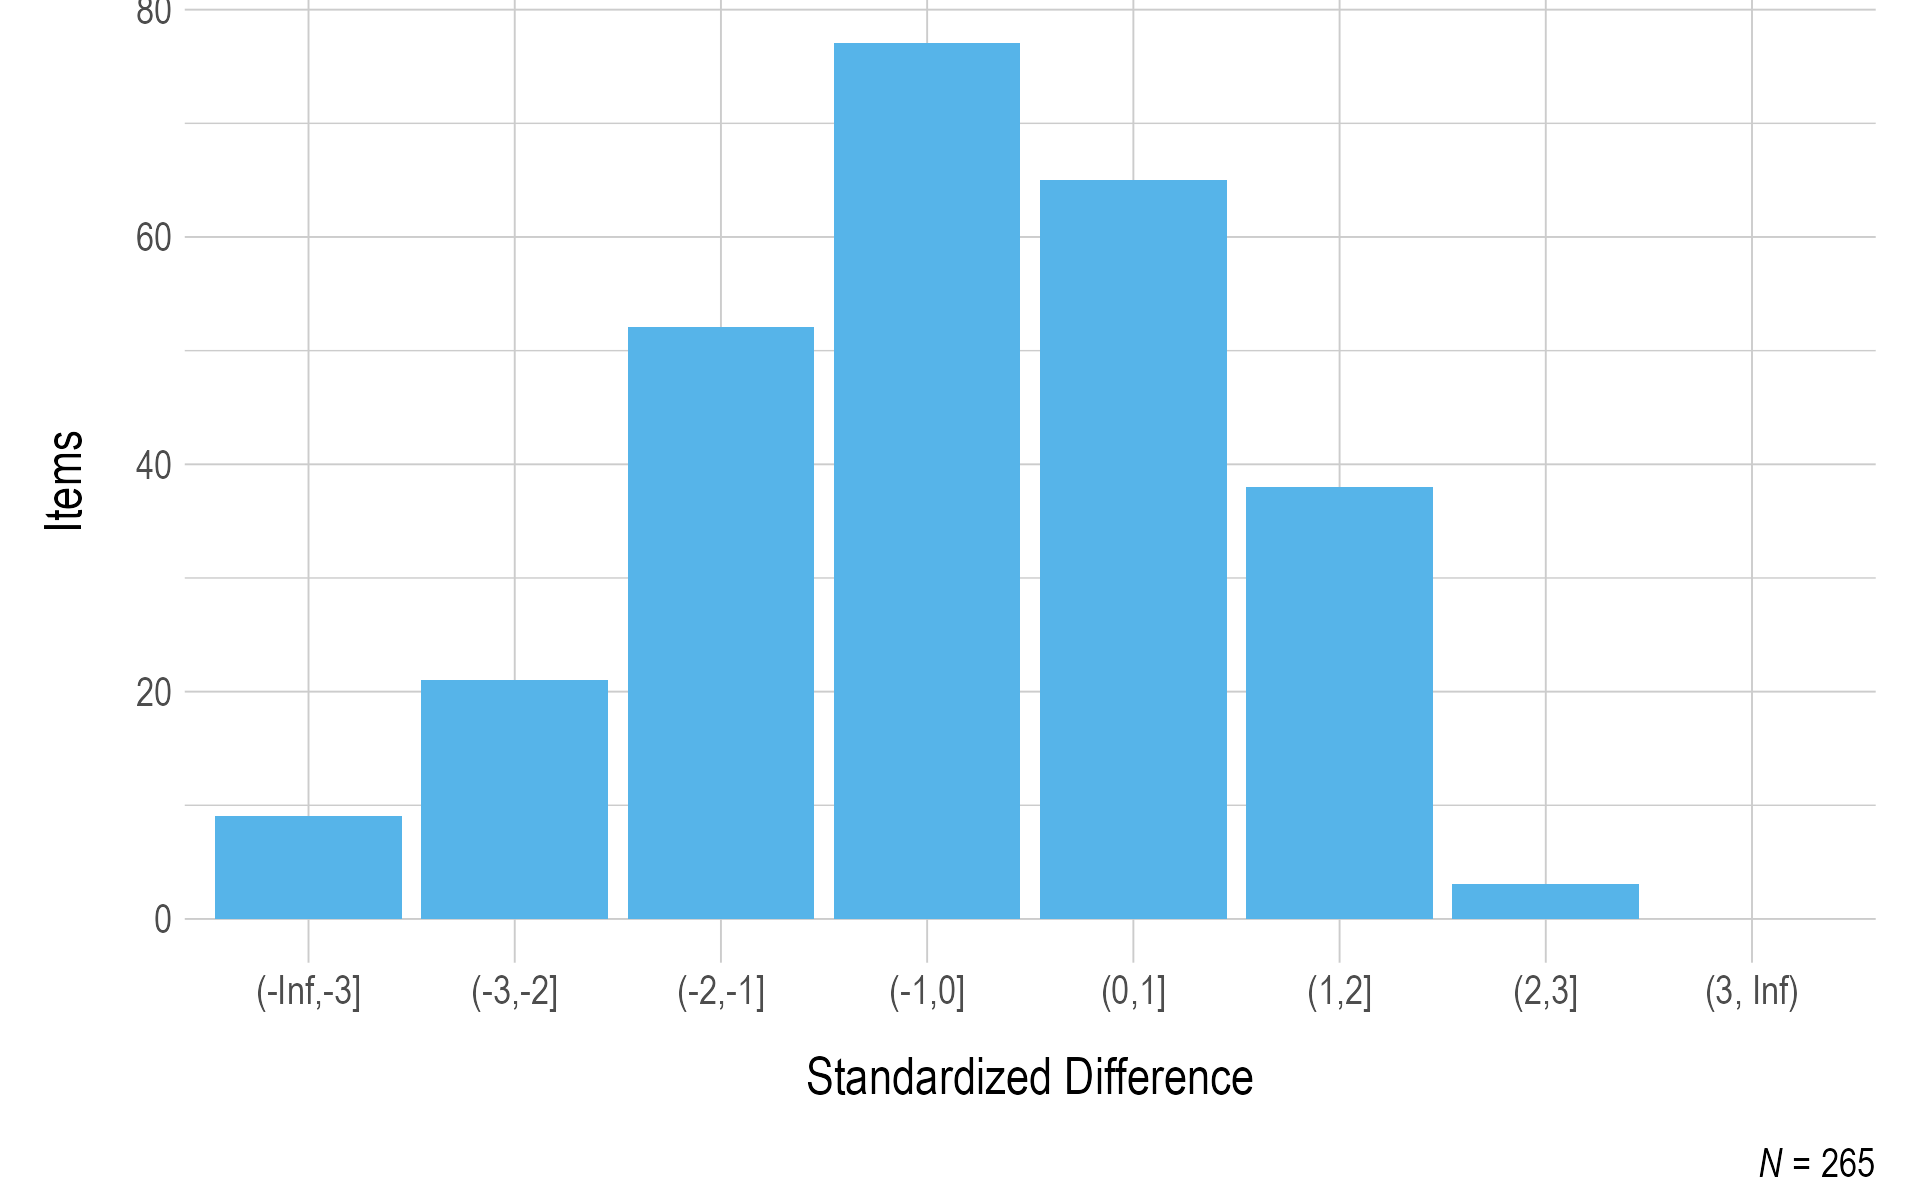
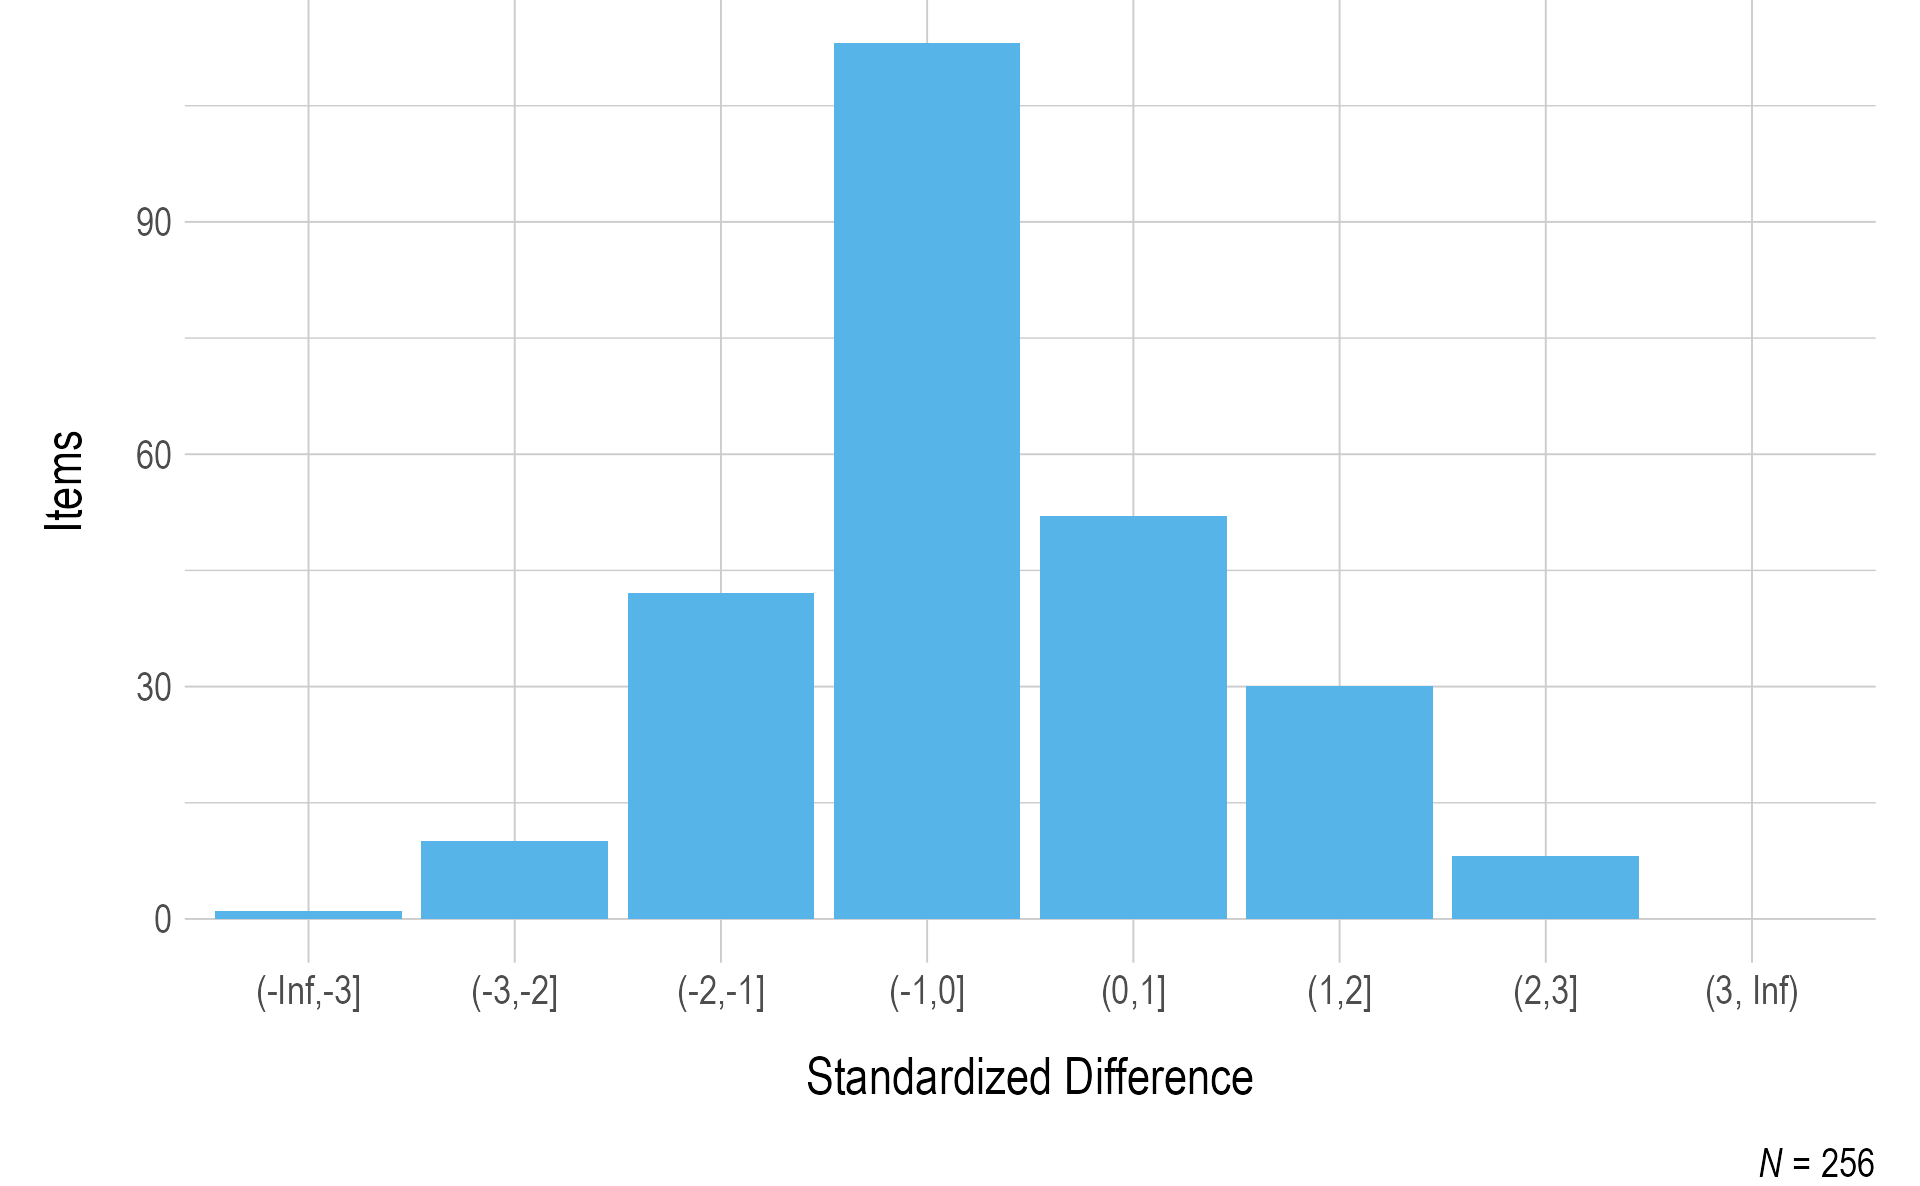
Figure 3.3 and Figure 3.4 summarize the standardized difference values for operational items for ELA and mathematics, respectively. Most items fell within two standard deviations of the mean of all items measuring the EE and linkage level. As additional data are collected and decisions are made regarding item pool replenishment, test development teams will consider item standardized difference values, along with item misfit analyses, when determining which items and testlets are recommended for retirement.
Figure 3.3: Standardized Difference Z-Scores for ELA 2020–2021 Operational Items
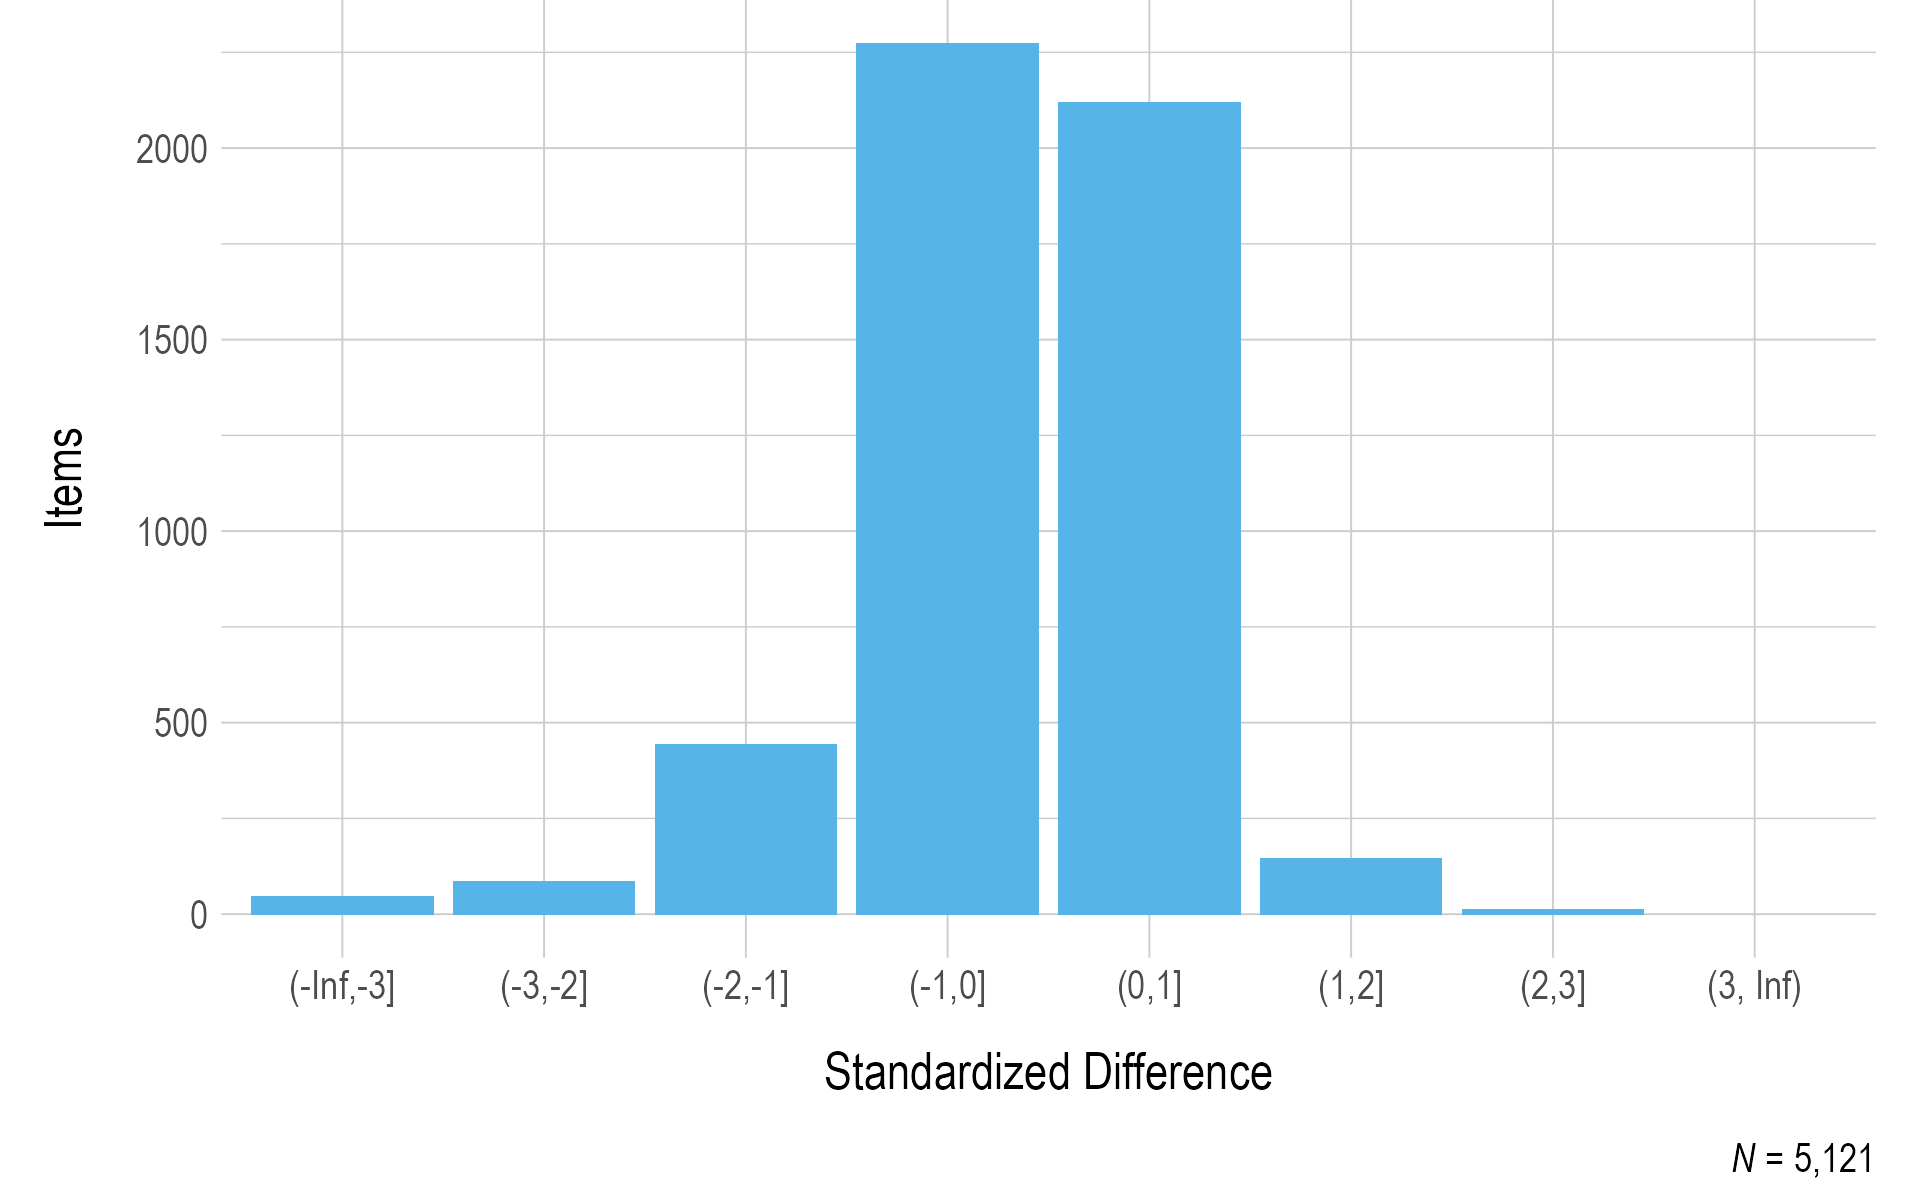
Note. Items with a sample size of less than 20 were omitted.
Figure 3.4: Standardized Difference Z-Scores for Mathematics 2020–2021 Operational Items
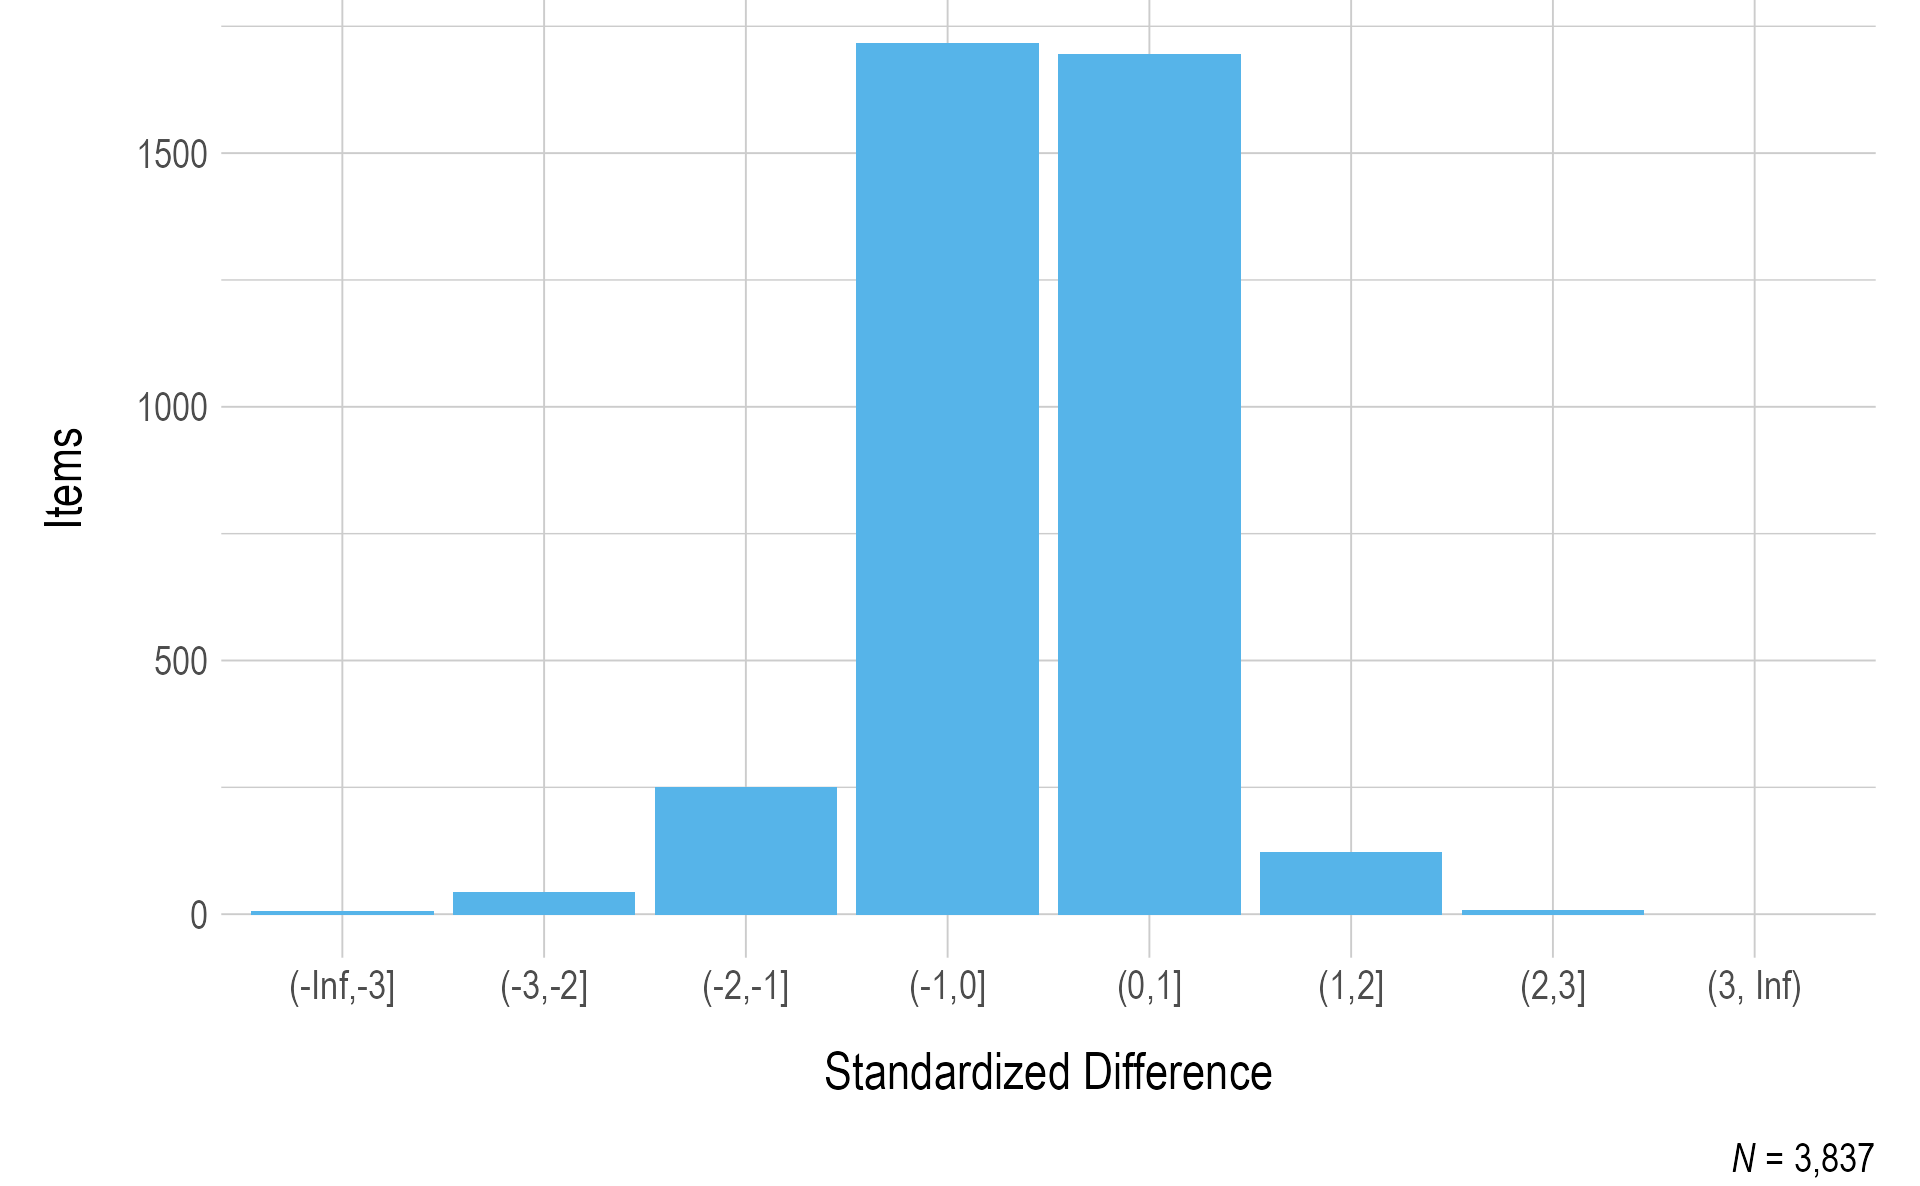
Note. Items with a sample size of less than 20 were omitted.
Figure 3.5 summarizes the standardized difference values for operational items by linkage level. Most items fell within two standard deviations of the mean of all items measuring the respective EE and linkage level, and the distributions are consistent across linkage levels.
Figure 3.5: Standardized Difference Z-Scores for 2020–2021 Operational Items by Linkage Level
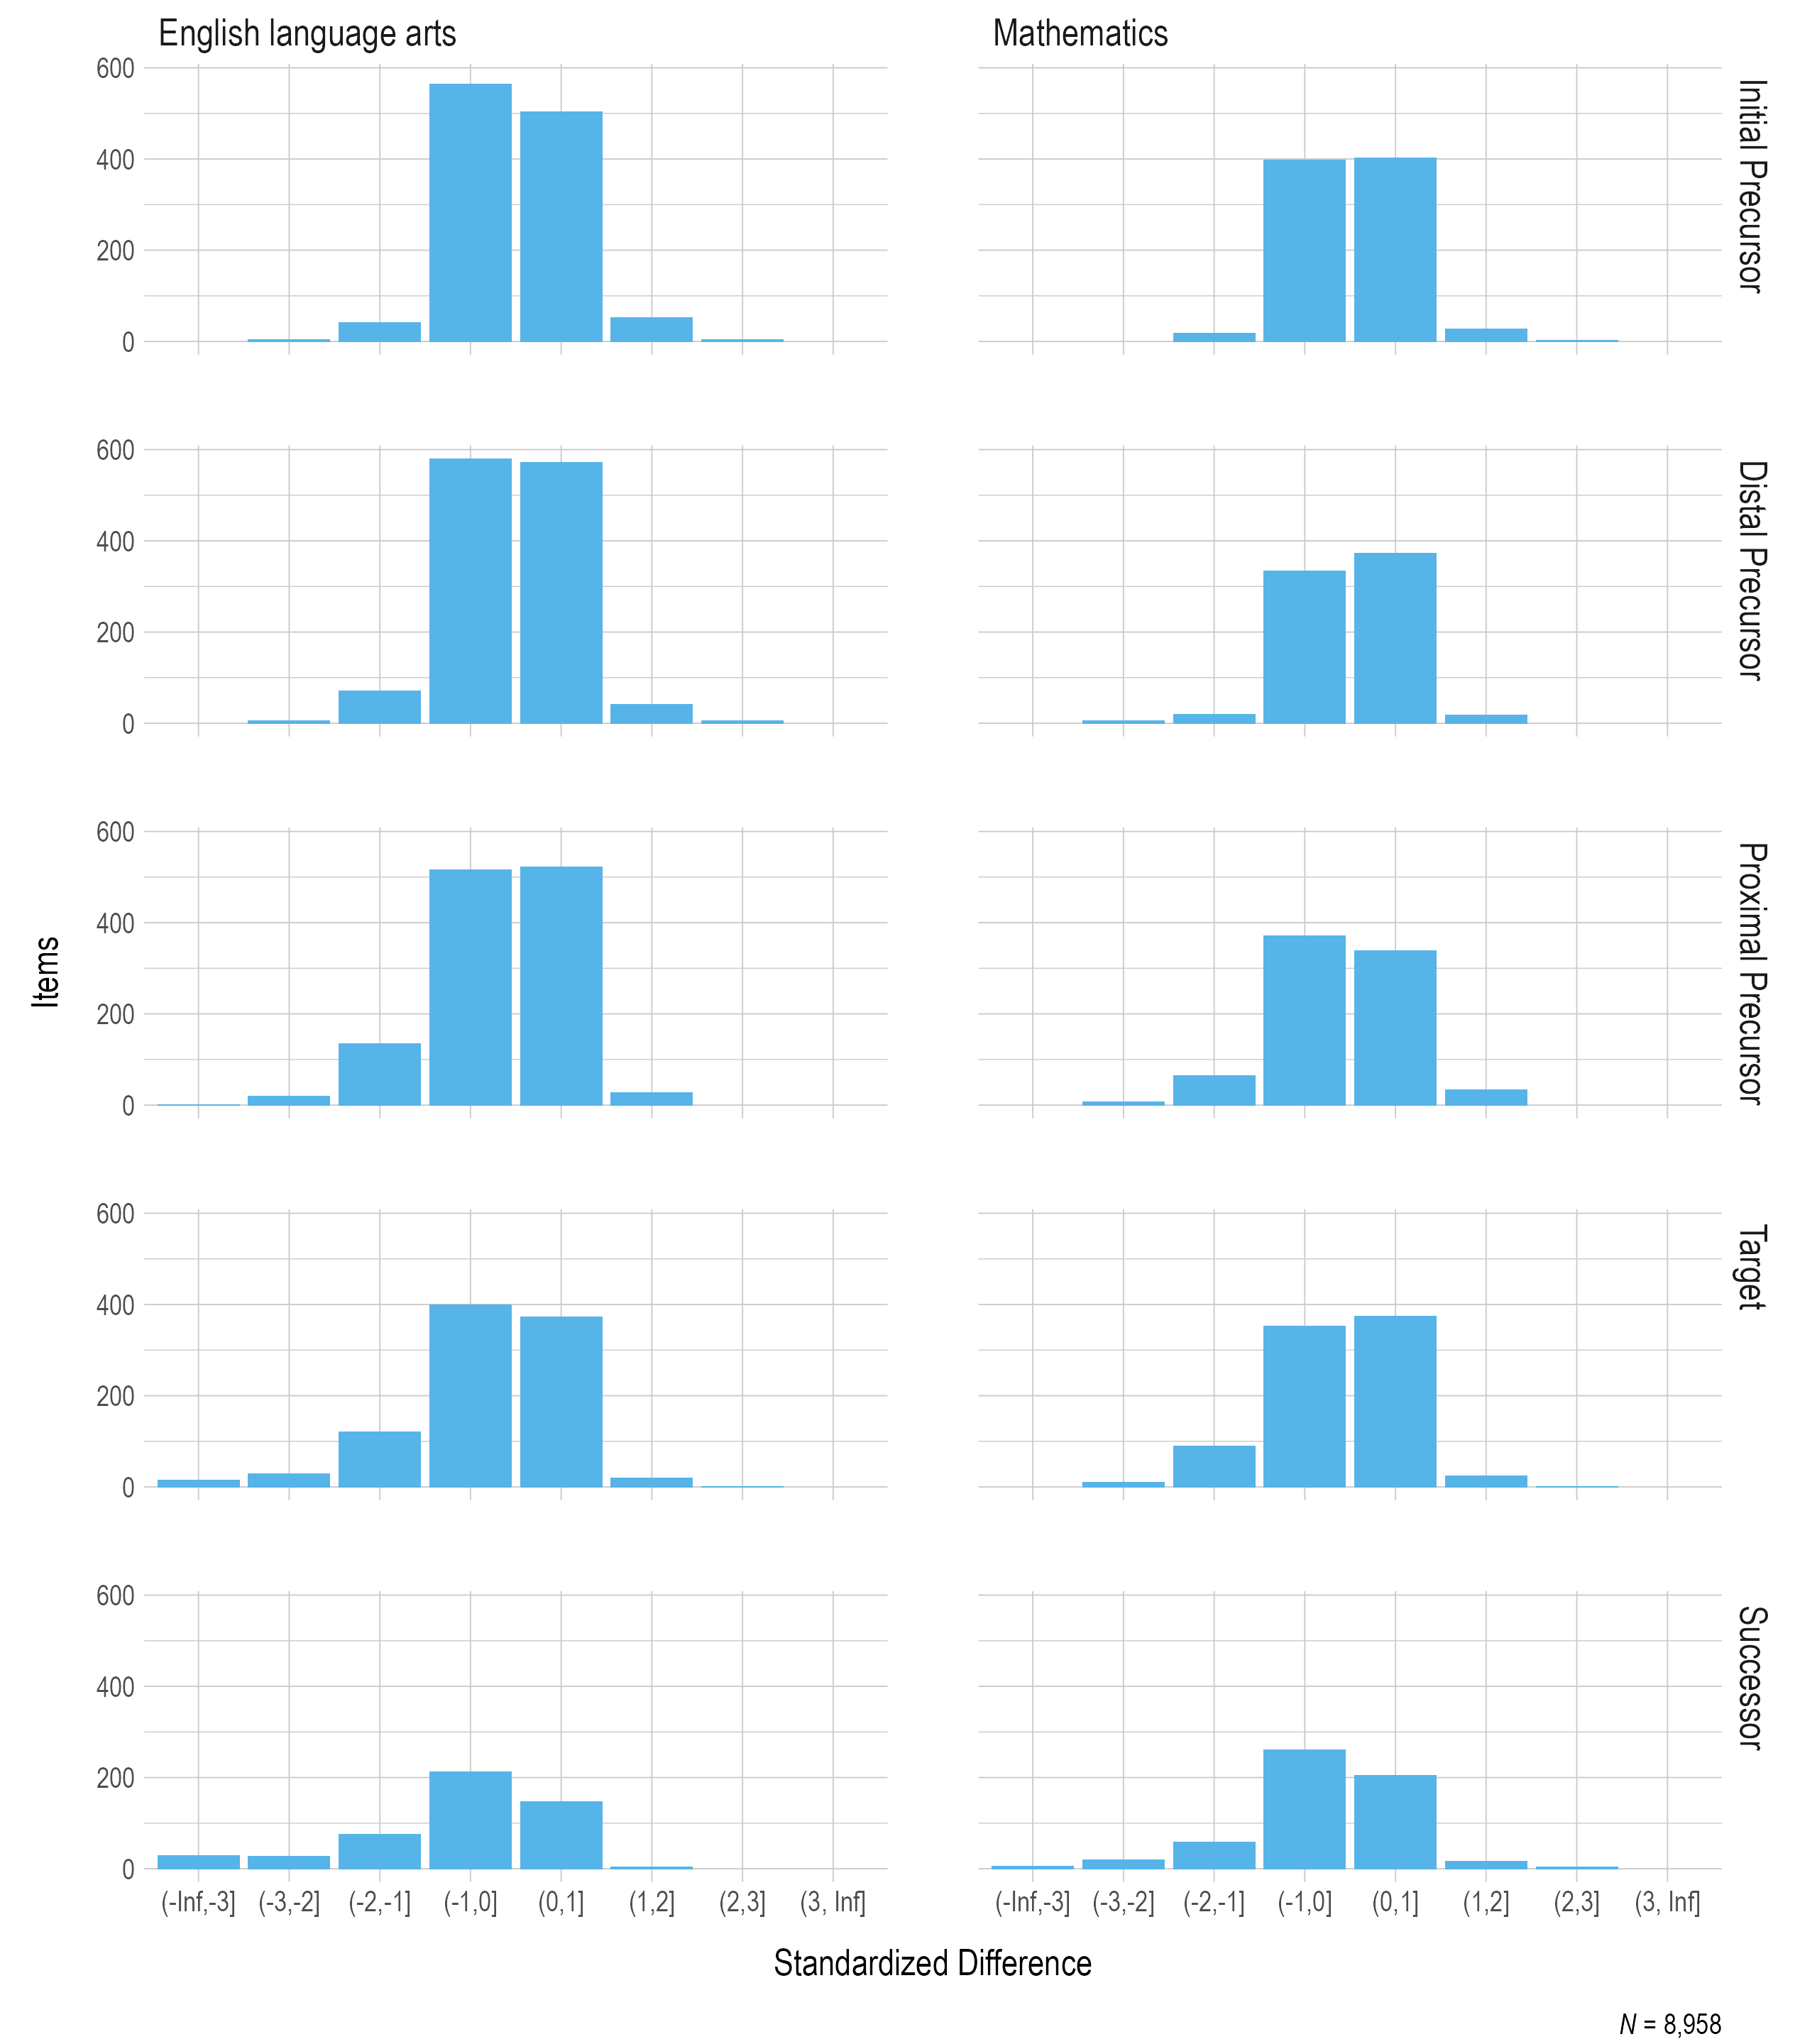
Note. Items with a sample size of less than 20 were omitted.
3.5 Field Testing
During the 2020–2021 year, DLM field tests were administered to evaluate item quality for EEs assessed at each grade level for ELA and mathematics. Field testing is conducted to deepen operational pools so that multiple testlets are available in each of the instructionally embedded windows, including making more content available at EEs and linkage levels that teachers administer to students the most. By deepening the operational pool, testlets can also be evaluated for retirement in instances in which other testlets perform better.
In this section we describe the field tests administered in 2020–2021 and the associated review activities. A summary of prior field test events can be found in the Summary of Results from the 2014 and 2015 Field Test Administrations of the Dynamic Learning Maps Alternate Assessment System (A. Clark et al., 2016), Chapter 3 of the 2014–2015 Technical Manual—Integrated Model (Dynamic Learning Maps Consortium, 2016a), and subsequent annual DLM technical manual updates.
3.5.1 Description of Field Tests Administered in 2020–2021
Field tests were administered after in both the fall and spring windows after blueprint coverage requirements were met. A field test testlet was assigned for an EE that was assessed during the operational assessment at a linkage level equal or adjacent to the linkage level of the operational testlet.
Testlets were made available for field testing in both the fall and spring windows based on the availability of field test content for each EE and linkage level. Table 3.10 summarizes the number of field test testlets available during 2020–2021. A total of 372 were available across grades, subjects, and windows.
|
Fall window
|
Spring window
|
|||
|---|---|---|---|---|
| Grade | English language arts (n) | Mathematics (n) | English language arts (n) | Mathematics (n) |
| 3 | 13 | 14 | 17 | 7 |
| 4 | 10 | 13 | 10 | 11 |
| 5 | 14 | 14 | 18 | 13 |
| 6 | 15 | 11 | 17 | 5 |
| 7 | 13 | 14 | 14 | 4 |
| 8 | 12 | 14 | 17 | 10 |
| 9–10 | 9 | 11 | 17 | 18 |
| 11–12 | 7 | * | 10 | * |
| * In mathematics, high school is banded in grades 9–11. | ||||
Participation in field testing was not required, but teachers were encouraged to administer all available testlets to their students. Field test participation rates for ELA and mathematics in the fall and spring windows are shown in Table 3.11. Note that because the Instructionally Embedded and Year-End models share an item pool, participation numbers are combined across all states. In total, 66% of students in ELA and 59% of students in mathematics completed at least one field test testlet. In the fall window, 59% of field test testlets had a sample size of at least 20 students (i.e., the threshold for item review). In the spring window, 85% of field test testlets had a sample size of at least 20 students.
|
Fall window
|
Spring window
|
Combined
|
||||
|---|---|---|---|---|---|---|
| Subject | n | % | n | % | n | % |
| English language arts | 3,320 | 36.7 | 44,654 | 65.5 | 45,310 | 66.0 |
| Mathematics | 3,050 | 34.4 | 39,791 | 58.5 | 40,446 | 59.0 |
3.5.2 Field Test Data Review
Data collected during each field test are compiled, and statistical flags are implemented ahead of test development team review. Flagging criteria serve as a source of evidence for test development teams in evaluating item quality; however, final judgments are content based, taking into account the testlet as a whole, the underlying nodes in the DLM maps that the items were written to assess, and pool depth.
Review of field test data occurs annually during February and March. This includes data from the immediately preceding fall and spring windows. That is, the review in February and March of 2021 includes field test data collected during the 2019–2020 spring window and the 2020–2021 fall window. Data that was collected during the 2021 spring window will be reviewed in February and March of 2022, with results included in the 2021–2022 technical manual update.
Due to the COVID-19 pandemic and the cancellation of spring assessments in 2020, no field test data was available from spring 2020. Assessments were administered in fall 2020; however, instruction and assessment faced disruptions due to the continuing COVID-19 pandemic. The evaluate the comparability of data collected during the 2020 fall window, the DLM staff compared the collected data to what was collected in during the 2019 fall window (pre-pandemic). These analyses were then used to inform the decision of whether to use data from the 2020 fall window for testlet promotion decisions. The following section describes the analyses performed to determine the comparability of 2019 and 2020 field test data.
3.5.2.1 Fall 2020 Field Testing
As expected, there was an overall decrease in participation during the fall 2020 administration. In across all grades and subjects, 4,747 students (52%) completed at least one field test testlet. In 2019, 6,892 students (65%) completed at least one field test testlet. Despite, overall lower participation, the demographic makeup of the student population was relatively consistent from the 2019 fall window to the 2020 fall window. The percentages of students in each gender and race subgroup in 2020 were within 3 percentage point of the distributions observed in 2019. For a complete demographic breakdown of the entire 2020–2021 student population, see Chapter 7 of this manual.
In addition to comparing the sample characteristics, we also compared performance on existing items. If students’ instruction was disrupted, it is possible that assessment performance would be impacted. For example, students might answer fewer items correctly if they were not able to receive the same quantity and intensity of instruction that they would receive in a normal year. This may result in field test items looking more difficult than they would in a normal year, influencing the review of the data. To evaluate performance across year, we compare the p-values for operational items that were administered in both 2019 and 2020. These p-values are shown in Figure 3.6. Overall, there were strong correlations between item-level p-values in 2019 and 2020. Thus, the data collected during fall indicates that the sample demographics and performance during fall 2020 were similar to what would be expected during a normal year.
Given these findings, and in consultation with the DLM Technical Advisory Committee, DLM staff elected to proceed with use of the fall 2020 field test data for item review. Note that this decision does not automatically result in the promotion of testlets to the operational pool. Rather, this decision only allows for the data to be reviewed by the Test Development team. The data review and promotion decisions are described in the following sections.
Figure 3.6: Comparison of Operational Probabilities Across Years
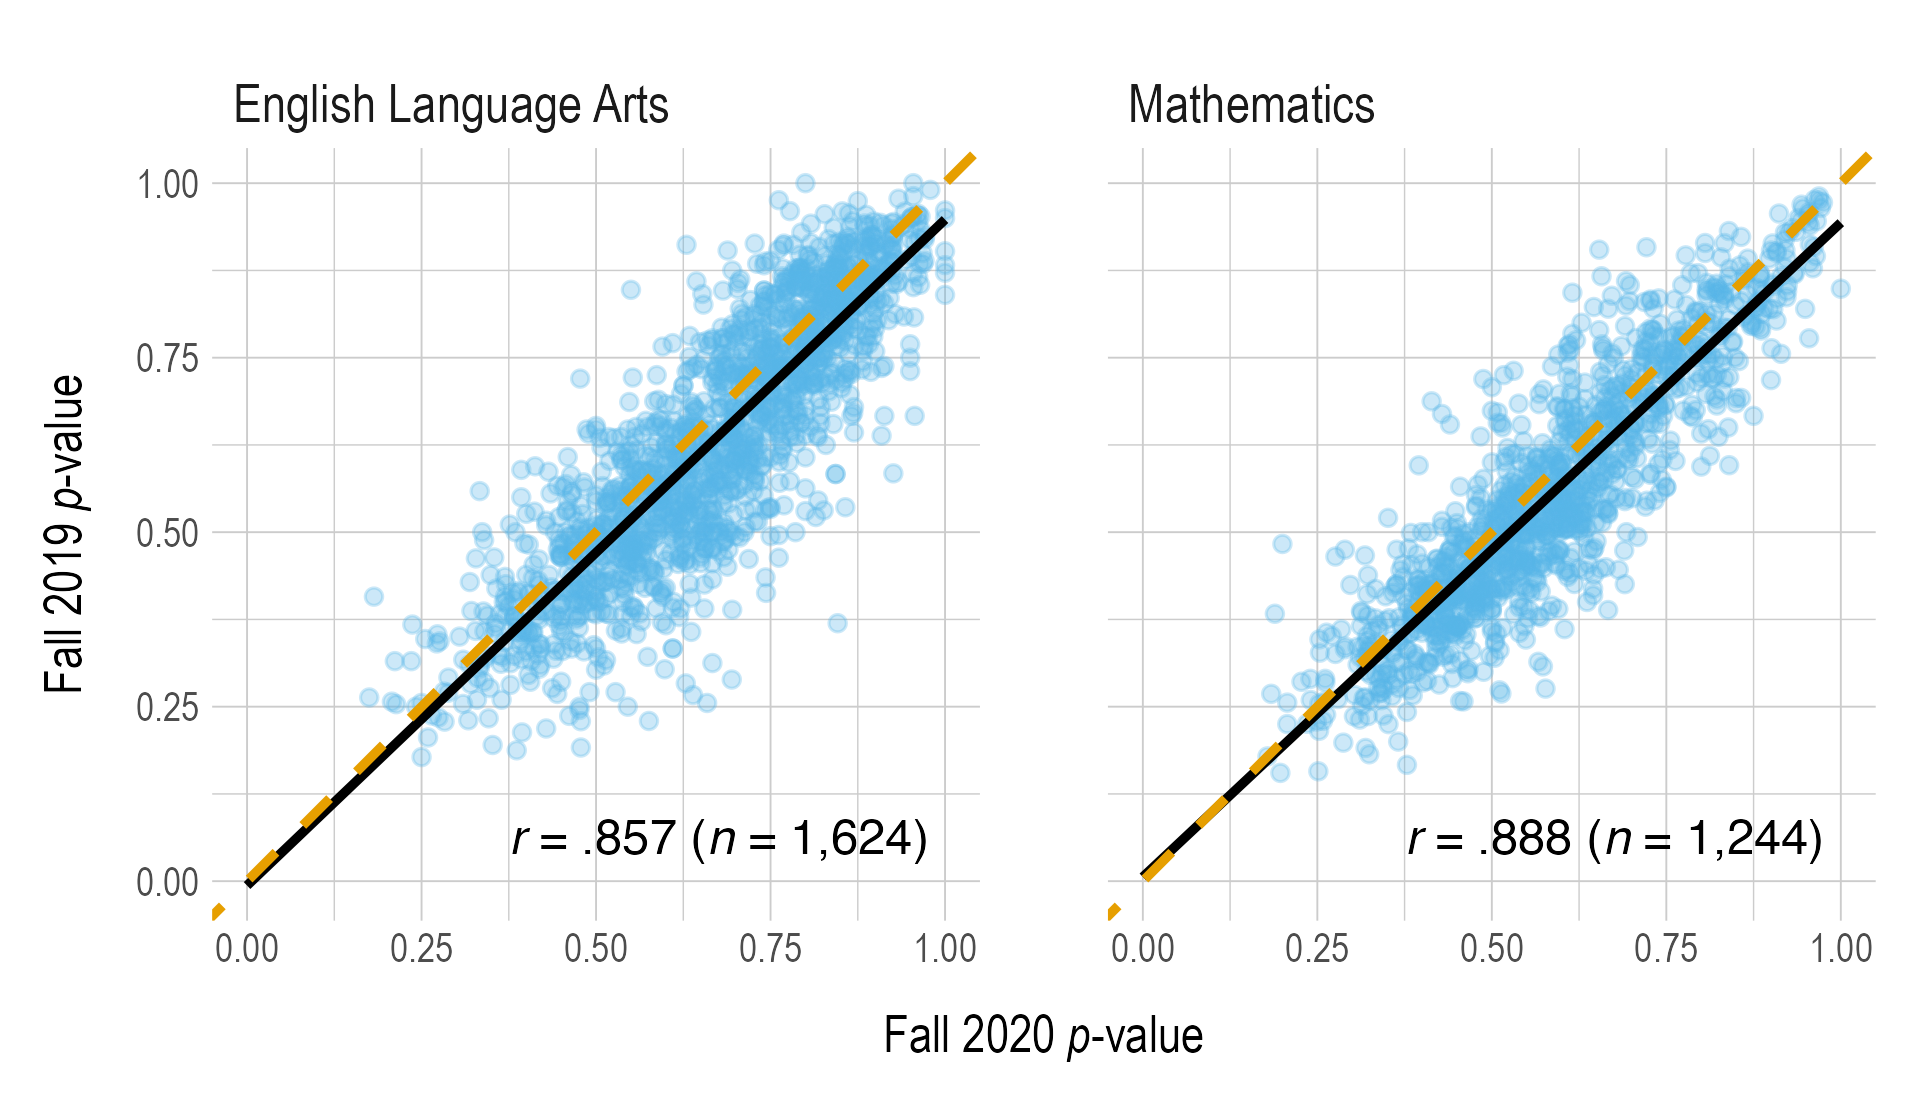
Note. The dashed orange line represents perfect agreement. The solid black line is the linear best fit line.
3.5.2.2 Item Flagging
Criteria used for item flagging during previous field test events were retained for 2020–2021. Items were flagged for review by test development teams if they met either of the following statistical criteria:
The item was too challenging, as indicated by a proportion correct (p-value) of less than .35. This value was selected as the threshold for flagging because most DLM items offer three response options, so a value of less than .35 may indicate less than chance selection of the option.
The item was significantly easier or harder than other items assessing the same EE and linkage level, as indicated by a weighted standardized difference greater than two standard deviations from the mean p-value for that EE and linkage level combination.
Figure 3.7 and Figure 3.8 summarize the p-values for items that met the minimum sample size threshold of 20. Most items fell above the .35 threshold for flagging. Test development teams for each subject reviewed items below the threshold.
Figure 3.7: Probabilities for English Language Arts Field Test Items
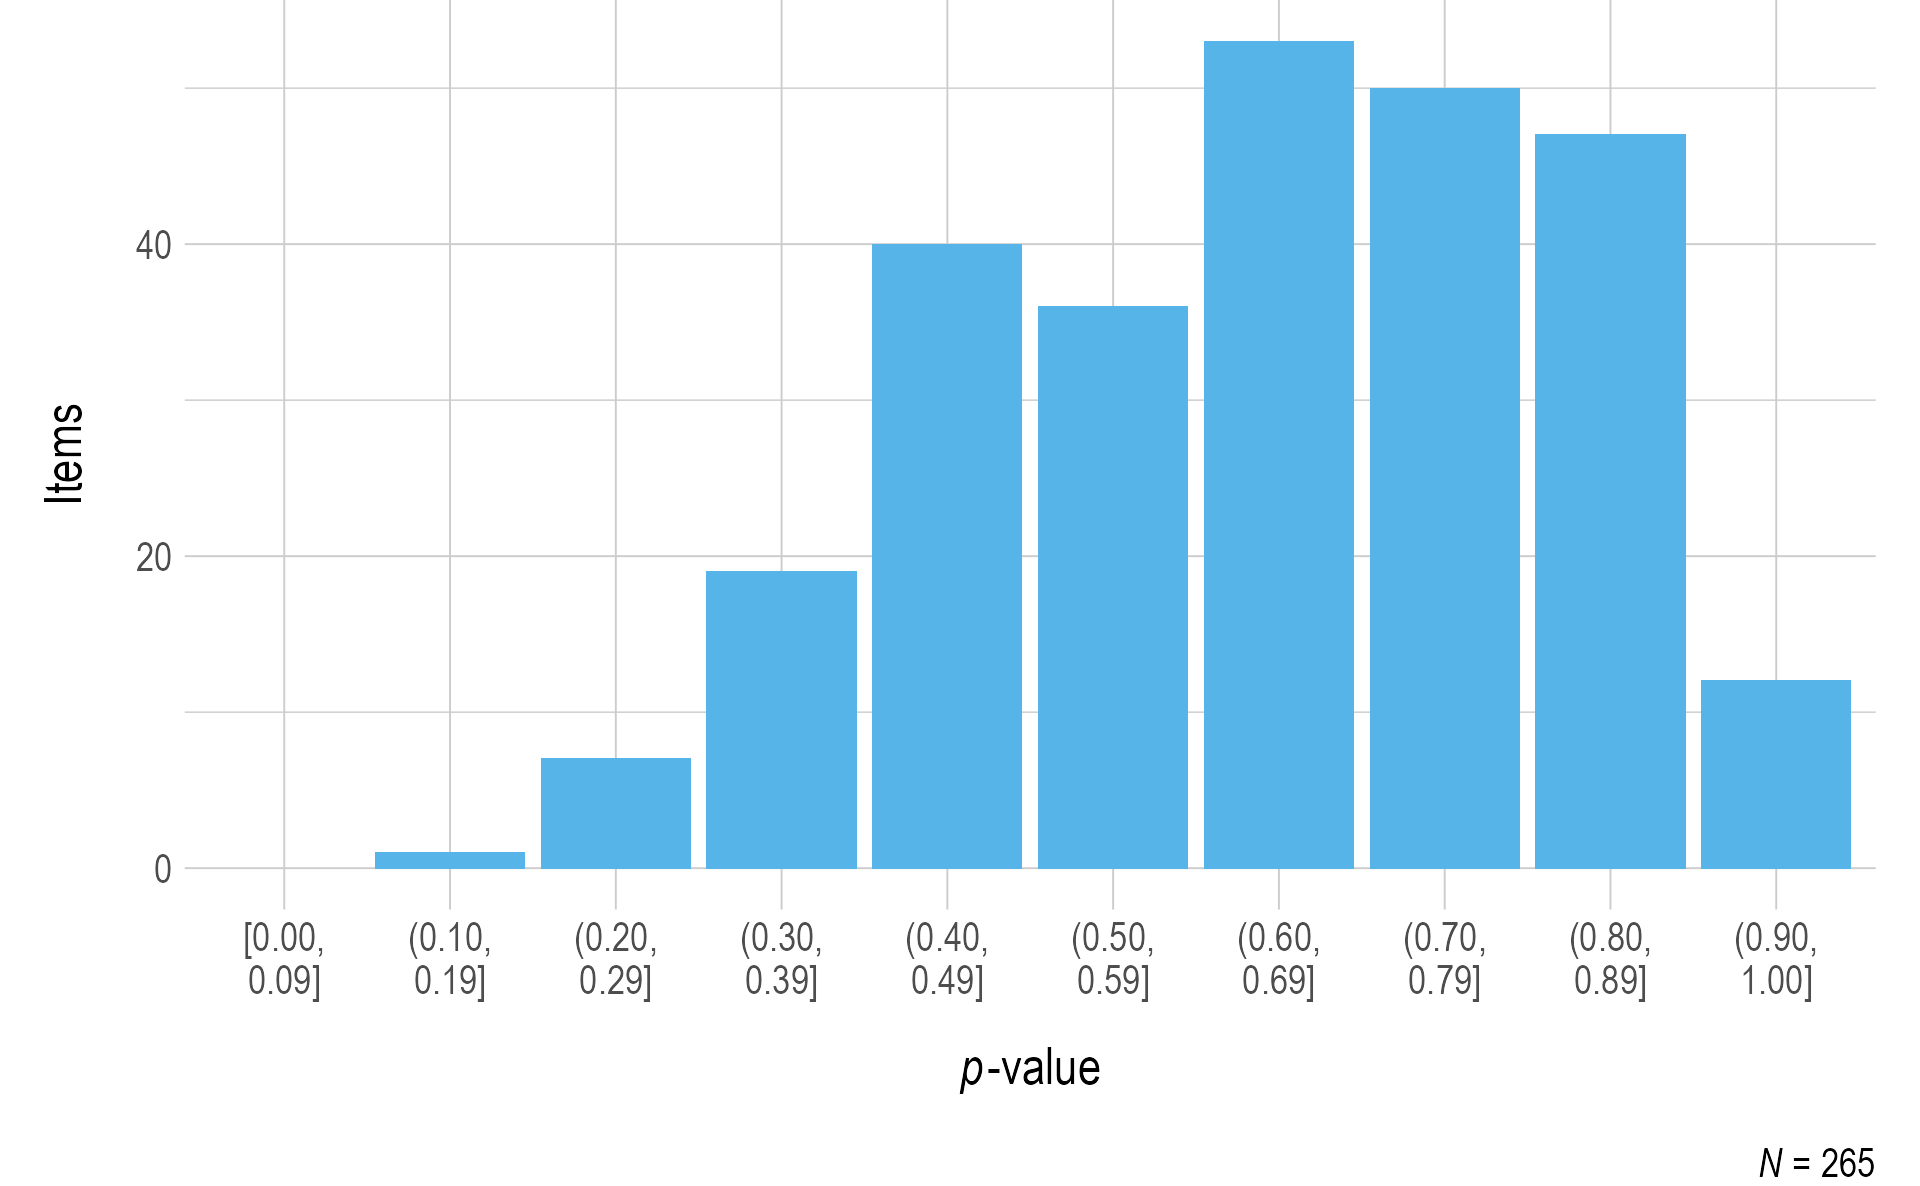
Note. Items with a sample size of less than 20 were omitted.
Figure 3.8: Probabilities for Mathematics Field Test Items
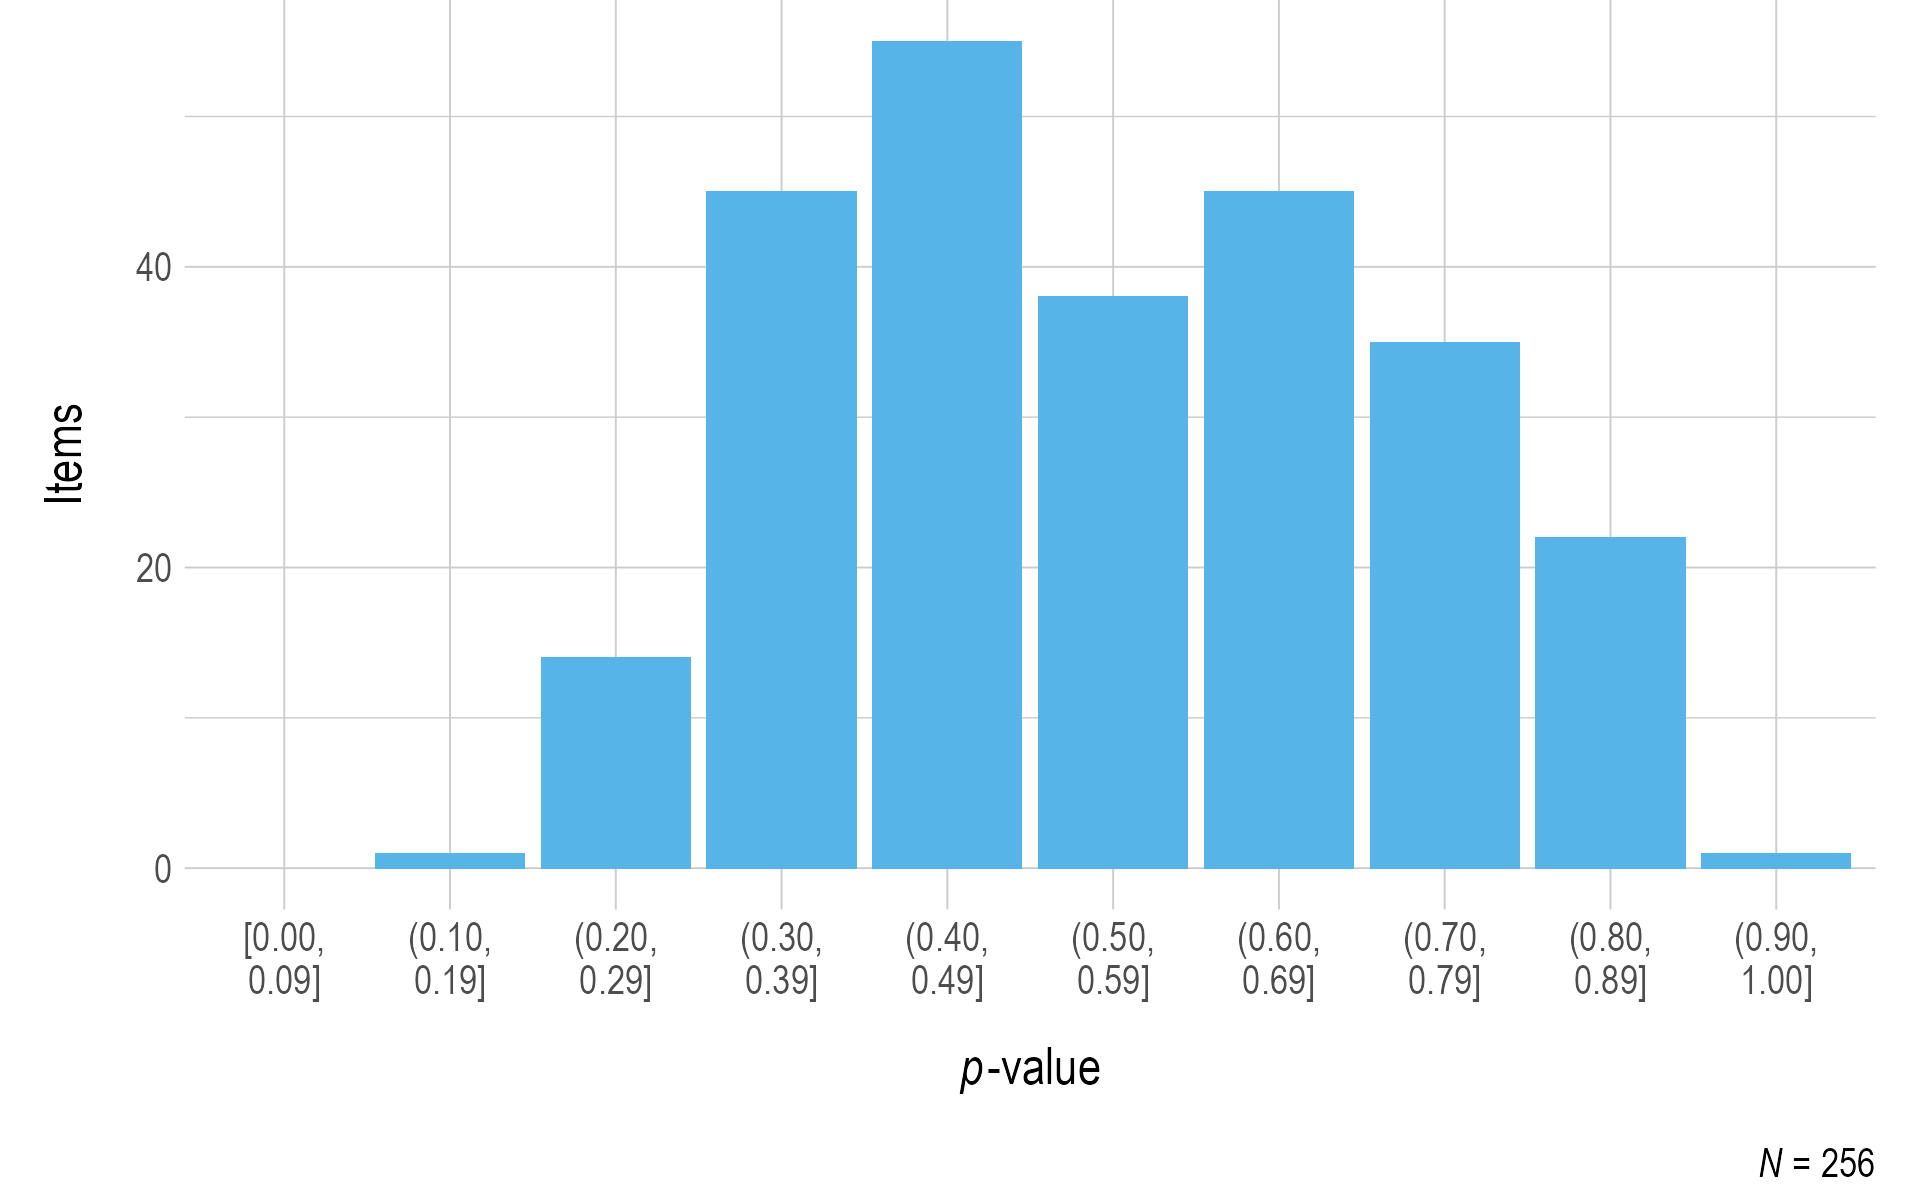
Note. Items with a sample size of less than 20 were omitted.
Figure 3.9 and Figure 3.10 summarize the standardized difference values for items field-tested during the instructionally embedded fall window for ELA and mathematics, respectively. Most items fell within two standard deviations of the mean for the EE and linkage level. Items beyond the threshold were reviewed by test development teams for each subject.
Figure 3.9: Standardized Difference Z-Scores for English Language Arts Field Test Items
Note. Items with a sample size of less than 20 were omitted.
Figure 3.10: Standardized Difference Z-Scores for Mathematics Field Test Items
Note. Items with a sample size of less than 20 were omitted.
3.5.2.3 Item Data Review Decision
Using the same procedures from prior field test windows, test development teams for each subject made four types of item-level decisions as they reviewed field test items flagged for either a p-value or a standardized difference value beyond the threshold:
- No changes made to item. Test development team decided item can go forward to operational assessment.
- Test development team identified concerns that required modifications. Modifications were clearly identifiable and were likely to improve item performance.
- Test development team identified concerns that required modifications. The content was worth preserving rather than rejecting. Item review may not have clearly pointed to specific edits that were likely to improve the item.
- Rejected item. Test development team determined the item was not worth revising.
For an item to be accepted as is, the test development team had to determine that the item was consistent with DLM item writing guidelines and that the item was aligned to the node. An item or testlet was rejected completely if it was inconsistent with DLM item writing guidelines, if the EE and linkage level were covered by other testlets that had better-performing items, or if there was no clear content-based revision to improve the item. In some instances, a decision to reject an item resulted in the rejection of the testlet, as well.
Common reasons for flagging an item for modification included items that were misaligned to the node, distractors that could be argued as partially correct, or unnecessary complexity in the language of the stem. After reviewing flagged items, the reviewers looked at all items rated as three or four within the testlet to help determine whether to retain or reject the testlet. Here, the test development team could elect to keep the testlet (with or without revision) or reject it. If a revision was needed, it was assumed the testlet needed field testing again. The entire testlet was rejected if the test development team determined the flagged items could not be adequately revised.
3.5.2.4 Results of Item Analysis and Test Development Team Review
A total of 27 ELA testlets (44%) and 27 mathematics testlets (51%) had at least one item flagged due to their p-value and/or standardized difference value. Test development teams reviewed all flagged items and their context within the testlet to identify possible reasons for the flag and to determine whether an edit was likely to resolve the issue.
Of the 34 ELA testlets that were not flagged, 32 (94%) were promoted to the operational pool and 2 (6%) were edited and reassigned to the field test pool. Of the 27 ELA testlets that had at least one item flagged, 20 (74%) were sent back to the field test pool with no edits for additional data collection, 4 (15%) were promoted to the operational pool after review by subjet matter experts, 2 (7%) were rejected and retired, and 1 (4%) was edited and reassigned to the field test pool. In mathematics, 26 testlets that were not flagged. Of these, 15 (58%) were promoted to the operational pool, 7 (27%) were edited and reassigned to the field test pool, and 4 (15%) were rejected and retired. Of the 27 mathematics testlets that had at least one item flagged, 20 (74%) were sent back to the field test pool with no edits for additional data collection, 4 (15%) were promoted to the operational pool after review by subjet matter experts, 2 (7%) were rejected and retired, and 1 (4%) was edited and reassigned to the field test pool.
3.6 Conclusion
During the 2020–2021 academic year, the test development teams conducted reduced, virtual events for both item writing and external review. Overall, 48 testlets were written for ELA and mathematics. Additionally, following external review, 98% of ELA testlets and 94% of mathematics testlets were retained with no or minor changes. Of the content already in the operational pool, most items had p-values within two standard deviations of the mean for the EE and linkage level. Field testing in 2020–2021 focused on collecting data from students on new content to refresh the operational pool of testlets.